
See your candidate funnel and conversion rates, drop-off rates, and other metrics at every stage in a role.
Click on the Job Analytics icon to the right of the pipeline of a role to see conversion rates and other metrics at each stage: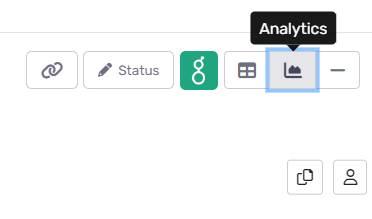
Here you can easily see your candidate funnel, activities taking place at each stage, and the total number of candidates processed and time spent on interviews.
In this article you will learn about:
Understanding Metrics
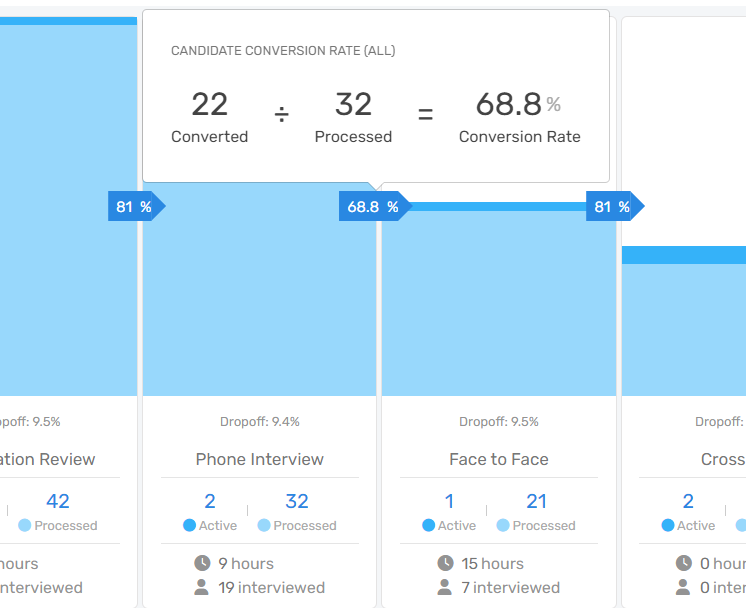
Hover over any metric to understand how it’s calculated or to drill down on the specific candidates included in that metric.
If you wish to add the Hires column to the pipeline, reach out to support@crosschq.com and we can add this column for you.
Conversion Rates
The conversion rate is the number of candidates converted by the total number of candidates processed.
Date Filter
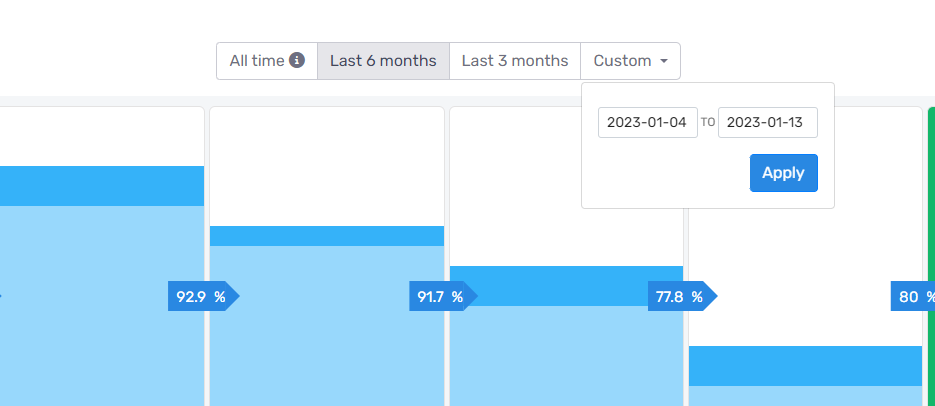
You will find a Date Filter at the top of your pipeline.
When this filter is applied, only candidates whose hired or rejected dates fall into that range will show up in your job analytics. However, all active candidates will also show up, regardless of the date range.
Drop-off Rates
The Drop-off rate beneath the conversion rate is the number of candidates who have withdrawn or declined to finish an interview stage. This will help you know which stages you're losing candidates the most and you can re-assess with your team on how to change the interview to fix the "leaky" bucket.
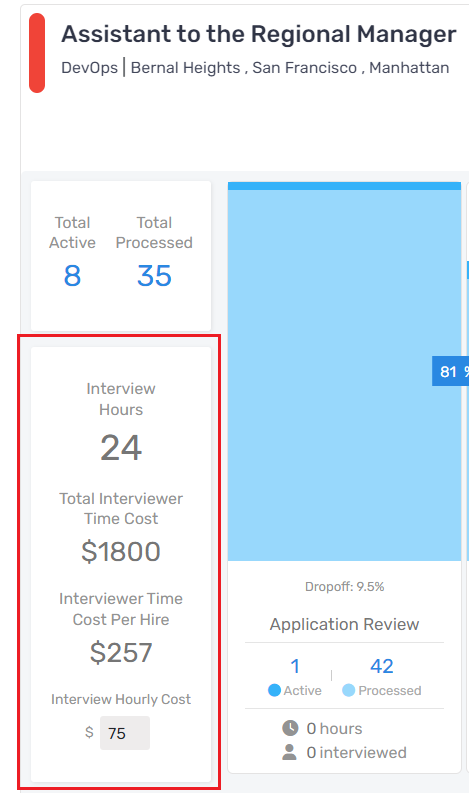
Interview Cost
On the left of the pipeline, you’ll easily be able to calculate interviewing costs simply by entering a cost per hour at the bottom here.
Projected Hires
Finally, on the right panel, you can calculate your projected hires. Just click on the wrench icon and a window will appear where you can add the expected conversion rate of each stage based on historical data.
If this is a new role and there isn’t a dataset for it, you can simply estimate the conversion rates based on other roles for that hiring department and adjust them as needed.