
In October 2022, Crosschq launched a significant update to the way the Quality of Hire (QoH) metric is calculated within the platform.
Synopsis:
- Previously, QoH was a function of only performance and retention. With this update, in addition to performance and retention, your QoH calculation now takes into account all of the data inputs you may be collecting via the full Pulse survey: culture add, engagement, rehireability, and promotability.
- These inputs can now be custom weighted to more accurately reflect your organization's unique values and business goals. Reach out to your Customer Success Manager to discuss how you'd like to approach customizing your QoH input weights within your Insights instance. Input weights can only be edited via the backend.
- QoH V3 acts more like a credit score than previous versions, meaning that each new hire's score is continually updated as new information becomes available.
QoH V3 Explained
The newest iteration of Quality of Hire is more customizable and quantitatively robust than previous versions. While QoH V2 included just retention and performance, this version supports retention and all full survey Pulse questions: performance, culture add, engagement, rehireability, and promotability.
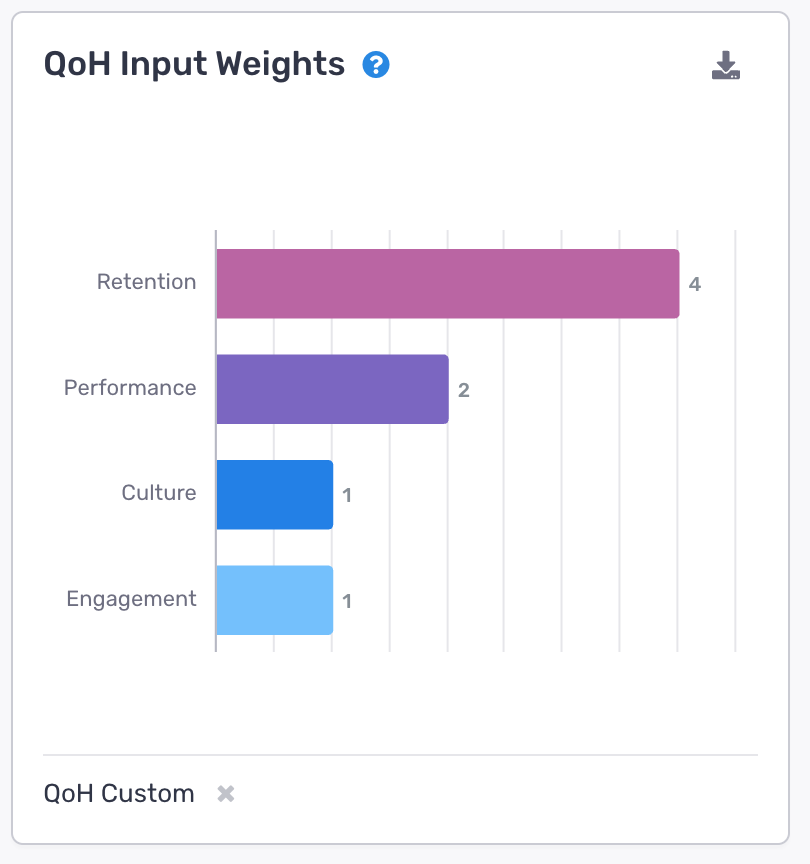
Moreover, organizations can set the relative importance of these inputs via custom QoH Input Weights. The result is a highly customizable Quality of Hire metric that reflects organizations’ unique values and business goals. Like previous versions, organizations can set the QoH New Hire Period length to reflect over how many months they would like to measure QoH.
QoH V3 acts more like a credit score than previous versions, meaning that each new hire's score is continually updated as new information becomes available (such as a new manager Pulse response, or a change to employment status). In QoH V2, a new hire would have an independent QoH score for each month of their new hire period, and their overall QoH score would be the average of those values. In this version, the values are dependent on one another such that the QoH score in month 2 is an updated version of the QoH score in month 1 (updated to reflect the additional information that has since become available). The result is a more dynamic metric that responds to new information in real time. The rationale for this change is to more closely resemble a credit score and goes as follows: one does not have “bad” credit score months but rather has months that negatively impact their overall credit score. Like a credit score, QoH is a living metric that changes over time.
Technical Details
The QoH V3 algorithm is a weighted geometric mean of the inputs mentioned above: retention, performance, culture add, engagement, rehireability, and promotability. In practice, there is one layer of abstraction between these six raw inputs and those that are used in the QoH algorithm itself. Enter forecasting.
In the case of “retention,” we actually calculate the expected proportion of a new hire period that a new hire will complete. Consider the extremes, if a new hire fails to show up on the first day then their “retention” proportion is zero, while a new hire that successfully completes all months of their new hire period has a proportion of one. We use this method because it allows us to think in the same terms about three distinct types of new hires:
- New hires who have completed their new hire period
- New hires who terminated during their new hire period
- New hires who are currently in their new hire period
For the latter group, we must forecast unobserved periods, using the probability that they will churn in the remaining months of their new hire period. As such, we can fairly compare these three types of new hires. Mathematically, it also has the nice property of rewarding employee retention such that QoH trends upwards (barring termination or adverse performance) over the new hire period. This is because the probability that a new hire will terminate in future unobserved periods is greater than zero. (More on this later.)
For inputs other than retention, we calculate their expected value in future periods using the information available to us at present. For example, if a new hire has performance evaluations of 7 and 9 in months 1 and 2 respectively, then their forecasted future performance is 8, the simple average of the observed values. Each input’s forecast is updated independently such that the calculation is robust to situations where some inputs have more available data than others.
Suppose an organization runs a basic Pulse survey every month and a full survey every 3 months. In this scenario QoH is updated monthly as the retention and performance inputs will change at that frequency, but every 3 months the update will also include the additional Pulse questions.
Why a geometric mean?
There are several reasons for this choice.
First, a geometric mean rewards consistency in a way that a standard arithmetic mean does not. In our context, this means (no pun intended) that a new hire with incredible performance and very poor culture will have a lower QoH V3 than they would have QoH V2. For example, suppose your organization’s QoH calculation includes just performance and culture, weighted equally. Then, for a new hire with performance=10 and culture=2, the geometric mean is 4.5 while the arithmetic mean is 6.0.
Second, if any input’s value is zero then the entire geometric mean is zero. This has the nice property whereby if retention is zero (or as we discussed earlier the new hire never shows up) then their QoH score itself is zero too. In practice all inputs will be greater than zero but it implies that we are only concerned with a new hire’s post-hire outcomes when they are actually employed.
Third, it handles missing data easily which is important if customers have a unique Pulse configuration or have low hiring manager response rates in certain months.
Lastly, a geometric mean is simply an alternative method for calculating averages, and as such can still be described as a “mean” for simplicity. Yet at the same time it has a certain je ne sais quoi – a kind of Crosschq special sauce. That is not to say that QoH has been made deliberately complicated, but just that we have taken ownership of the maths going into the calculation and relied upon our industry expertise. Ultimately, our goal is to make understanding how QoH is calculated as simple as possible.
Isn’t it a little weird to use a geometric mean in the combination of the inputs but a simple arithmetic mean when “forecasting” each input?
Yes, a little. However, the forecasting functions of each input in the current QoH version are very simple and will be refined with time. In practice, the specific forecasting function is not integral to the QoH calculation. The current choice was made to avoid imposing too much structure on the data and follows from linear regression modeling. Subsequent versions of QoH will likely employ more sophisticated methods without affecting the interpretation of QoH.
How do the retention forecasts work?
Observed periods (those in which we know a new hire is either employed or terminated) are valued at 1 and 0 respectively. Periods that are unobserved (because they have not yet occurred) are valued at 0.95^t where t is how many periods in the future that period is. This means that one period ahead is valued at 0.95 (0.95^1) while five periods ahead is valued at 0.77 (0.95^5). The average of all new hire periods is taken, resulting in the expected proportion of the new hire period that a new hire will complete (as of time t).
Where does 0.95 come from?
The 0.95 probability is chosen to reflect a 5% chance that a new hire will churn in any given month. In practice this is high, especially at the beginning of a new hire’s employment. Future models will refine this estimate and likely estimate it from an organization’s own historical data and market conditions. (This amounts to an 86% probability that a new hire will be employed after 3 months, 74% after 6 months, and 54% after 12 months.)
As an example, suppose a new hire has completed 3 months of the 6 month new hire period and is still employed. Months 1, 2, and 3 are all scored as 1, month 4 is 0.95, month 5 is 0.95^2=0.9, and month 6 is 0.95^3=0.86. Together this sums to 5.71, divided by 6 is 0.952. In words, we would say that we expect this new hire to complete 95.2% of their new hire period. Of course as they remain in the role for longer, this number approaches 100%.
Benchmarking
There is a tradeoff between customizability of the QoH calculation and its use for benchmarking. Is it really fair to compare across organizations that have drastically different hiring objectives and therefore QoH input weights as well?
In practice we’ve added a selector to components in the QoH tab to allow organizations to toggle between “QoH Custom” with their own input weights, and “QoH Base” with standard equally-weighted performance and retention input weights. They can, if desired, compare their QoH Custom value to the industry QoH Base benchmark – but these comparisons need to be taken with a grain of salt. See the below figure where we see this combination of custom QoH and base QoH for benchmarking in action.

How do I get started customizing my QoH input weights?
Reach out to your Crosschq CSM today to discuss what input weight combination makes the most sense based on your organizations unique values and business goals. From there, your CSM will be able to work with our product team to update you input weight via the backend.