Within Executive Tools, you can set your planned hiring goals and track attainment against different time periods and job-level groupings.
To set up your goals, click the Set Goals button from the Goals module.

You will be taken to a matrix where you can input your org's hiring goals across an entire fiscal year.
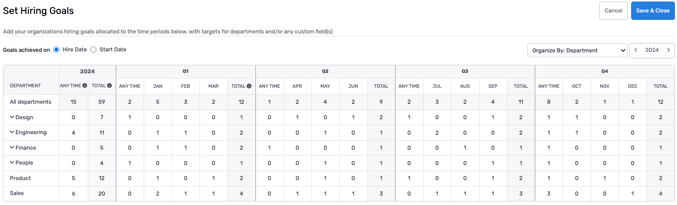
Within each quarter, goals can be entered at a monthly level or designated as "any time." Any time means that the hire is projected for some time in the respective quarter.
On the left side of the matrix, the yearly totals will aggregate all hire counts from each quarter. "Any time" hires can also be designated at a yearly level.
By default, goals are tracked per department. Additional goals matrices can be filled out based on job custom fields or by recruiter. Click the Organize By dropdown to view the additional matrices available from your ATS.
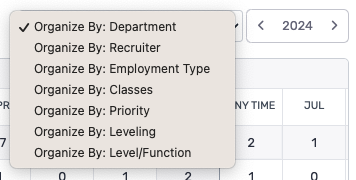
If you input goals by recruiter, the recruiters listed will be those who are assigned to open jobs in your ATS. When we identify a hire, the hire goal will be attributed to the recruiter assigned at the candidate level.
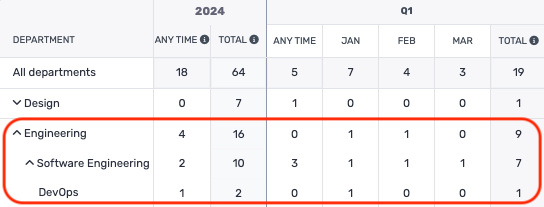
If an organizational grouping contains nested values, goals can be inputted at any descendant level. Totals from the descendant rows will roll up to the parent row.
Goals can also be defined by either hires or starts made in the fiscal year.
![]()
Once your goals have been inputted, click Save & Close.
The Goals module will update in near-real time with the hires made in your ATS.
Goal attainment can be displayed against a specific time period, as well as based on any of the groupings where you filled out a goals matrix.

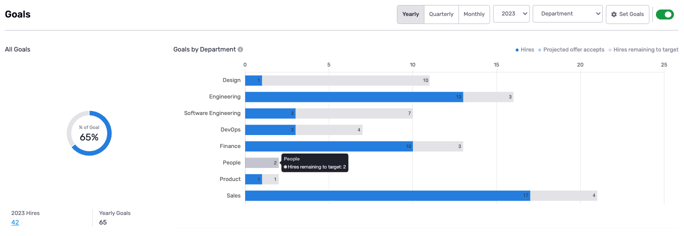
Once you have selected a timeframe and grouping, the module displays your hiring progress in two ways:
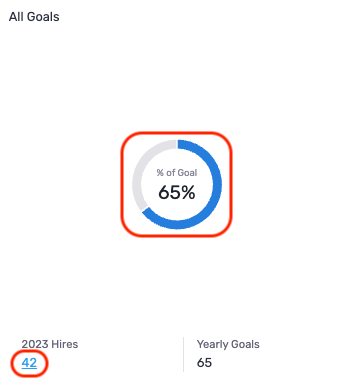
First, on the left hand side is a percentage of attainment for the selected time period. You can click on either the circular progress bar or the count of hires/starts to view all the candidates included in the data.
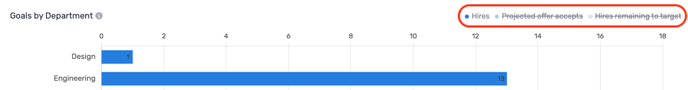
Second, on the right hand side is a bar chart showing attainment for the selected grouping. The bar chart shows three different metrics:
- Number of hires (or starts) made for each grouping subset. This number is blue on the bar.
- Projected offer accepts, which is calculated by taking the number of outstanding offers within the subset and multiplying that by the historical offer acceptance rate for the subset. For example, if there were 2 outstanding offers in a particular department, and the department had an offer acceptance rate of 50%, then the projected offer accept count would equal 1. This number is light blue on the bar.
- Hires remaining to target in each grouping subset. This is calculated by taking the goal inputted for the subset and subtracting number of hires (or starts) and projected offer accepts in the subset. This number is grey on the bar.
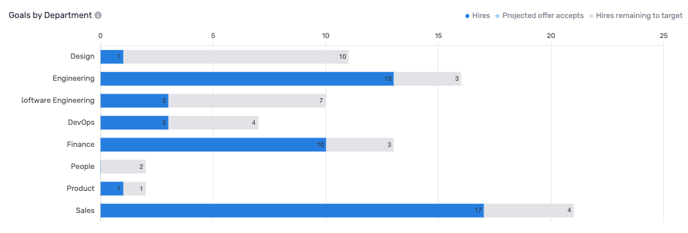
Any of these three metrics can be removed from the bar chart by clicking each label from the top legend. A strikethrough will appear on the label.