The Stages Summary section of Executive tools provides an aggregate-level overview of your jobs' pipeline performance and can be further analyzed based on your ATS' EEOC and demographic responses.
Within the main Stages Summary display, candidates can be viewed against two pipelines:
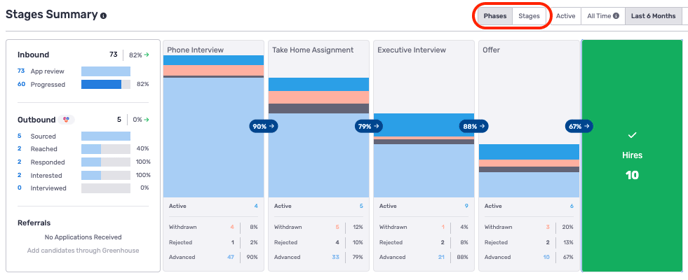
- Stages - these are the stages that come directly from your ATS
- Phases - these are normalized milestones in TalentWall that you can customize to form a unified pipeline across all of your jobs. You can learn more about phases here.
When you apply a date range to the pipeline, the date range will filter candidates based on their application date. Enabling the Active toggle will return all candidates from your open jobs:
![]()
The timeframe filters above only apply to data in the Stages Summary (and Funnel Segmentation) section of Executive Tools, but not other Executive Tools components like Goals, Job Health, and Jobs Summary.
To further segment Stages Summary data, you can also apply job-level filters from the top of the page:
![]()
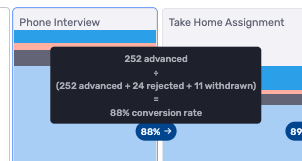
Between each stage or phase, TalentWall calculates a conversion rate that is defined as the following: (candidates who advanced to a future stage/phase) divided by (candidates who advanced, withdrew, or were rejected from the stage/phase). To see the exact metrics behind each conversion, hover over the conversion percentage:
Under each stage/phase, you will find metrics for active, rejected, advanced, and withdrawn candidates. If you click on any of these numbers, a window will pop-up to show all candidates counted under the respective category:
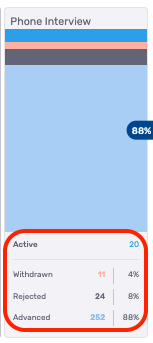
Alternatively, you can also click on the individual bars above these numbers.
To the very right of Stages Summary is a Totals window. The metrics on this area will calculate the following stats:
- Accepted - offers accepted within the date range
- Active - all currently active candidates (irrespective of date range)
- Projected Hires - the current aggregate projected hires count taken from each individual job's projected hires calculation
- Offers - offers created within the date range
- Declined - offers declined in the date range
- Withdrawn - candidates who withdrew in the date range
- Rejected - candidates who were rejected in the date range
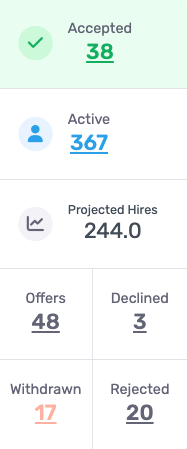
Keep in mind that the selected date range applies differently between the stages summary pipeline (based on application date) and the totals KPIs above (based on when the event happened e.g. Accepted Offer, Offer Created, Offer Declined, etc.).
Alongside your aggregate Stages (or Phases) Summary, you can enable the KPI toggle to view Interview and Time in Stage/Phase metrics across your hiring pipeline.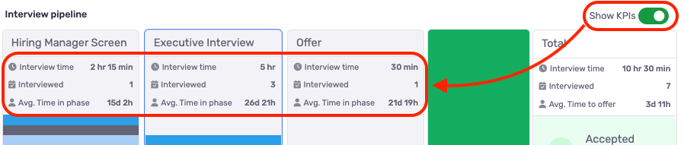
Funnel Segmentation
Below Stages Summary is Funnel Segmentation, which analyzes your candidate performance based on EEOC and/or demographic question responses.
In order to view EEOC and/or demographic question data, access to these endpoints need to be granted from your ATS. At the moment, this feature is supported by Greenhouse. If the endpoints have been granted, please reach out to your Crosschq account owner to enable this data into Funnel Segmentation. In addition, EEOC/diversity data needs to be enabled at the user-level to grant access to this feature.
Responses can be viewed against the following metric categories:
![]()
- Active: number of active candidates in stage for a segment;
- Conversion rate: (number of candidates advanced from stage) divided by (number of candidates advanced, rejected, or withdrawn from stage) for each segment
- Withdrawal rate: (number of candidates withdrawn from stage) divided by (number of candidates advanced, rejected, or withdrawn from stage) for each segment
- Rejection rate: (number of candidates rejected from stage) divided by (number of candidates advanced, rejected, or withdrawn from stage) for each segment
- Ratio to hire: number of candidates needed to be processed (advance, reject, withdraw) per stage to make one hire for each segment
To view pipeline by response, click the dropdown at the right and select either an EEOC segment or a demographic question. These questions will come straight from your ATS. There may be no demographic questions visible if you do not leverage this feature in your ATS.
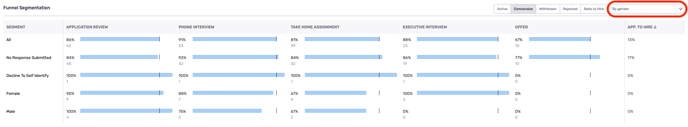
Data will be segmented by response (rows) and TalentWall phase (columns).
Within each metric category, we will track all responses on the first row, followed by each respective response option as additional rows.
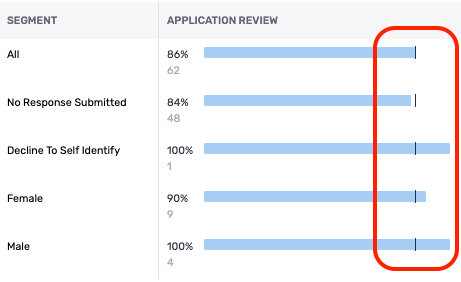
Each cell within the Funnel Segmentation grid contains a benchmarking line to indicate how a specific segment is tracking compared to all segment responses:
When viewing responses from the Conversion, Withdrawn, or Rejected categories, we present the data with a percentage and a number below it:
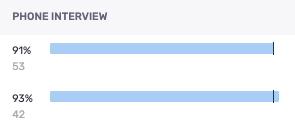
- The percentage reflects the conversion/withdrawal/rejection rate from the respective stage.
- The number below the percentage reflects the total candidates who were converted/withdrawn/rejected from the respective stage.
The job-level filters from Stages Summary will also apply to the data within the Funnel Segmentation section. Funnel Segmentation also uses the date range from Stages Summary and will filter candidates who applied in the timeframe.