A Quick Guide to Analytics
Analytics is where you'll find all your out-of-the-box hiring metrics at a glance.
For visual learners, here's a brief explainer on Analytics. For more details, continue reading!
Quick Access to Data
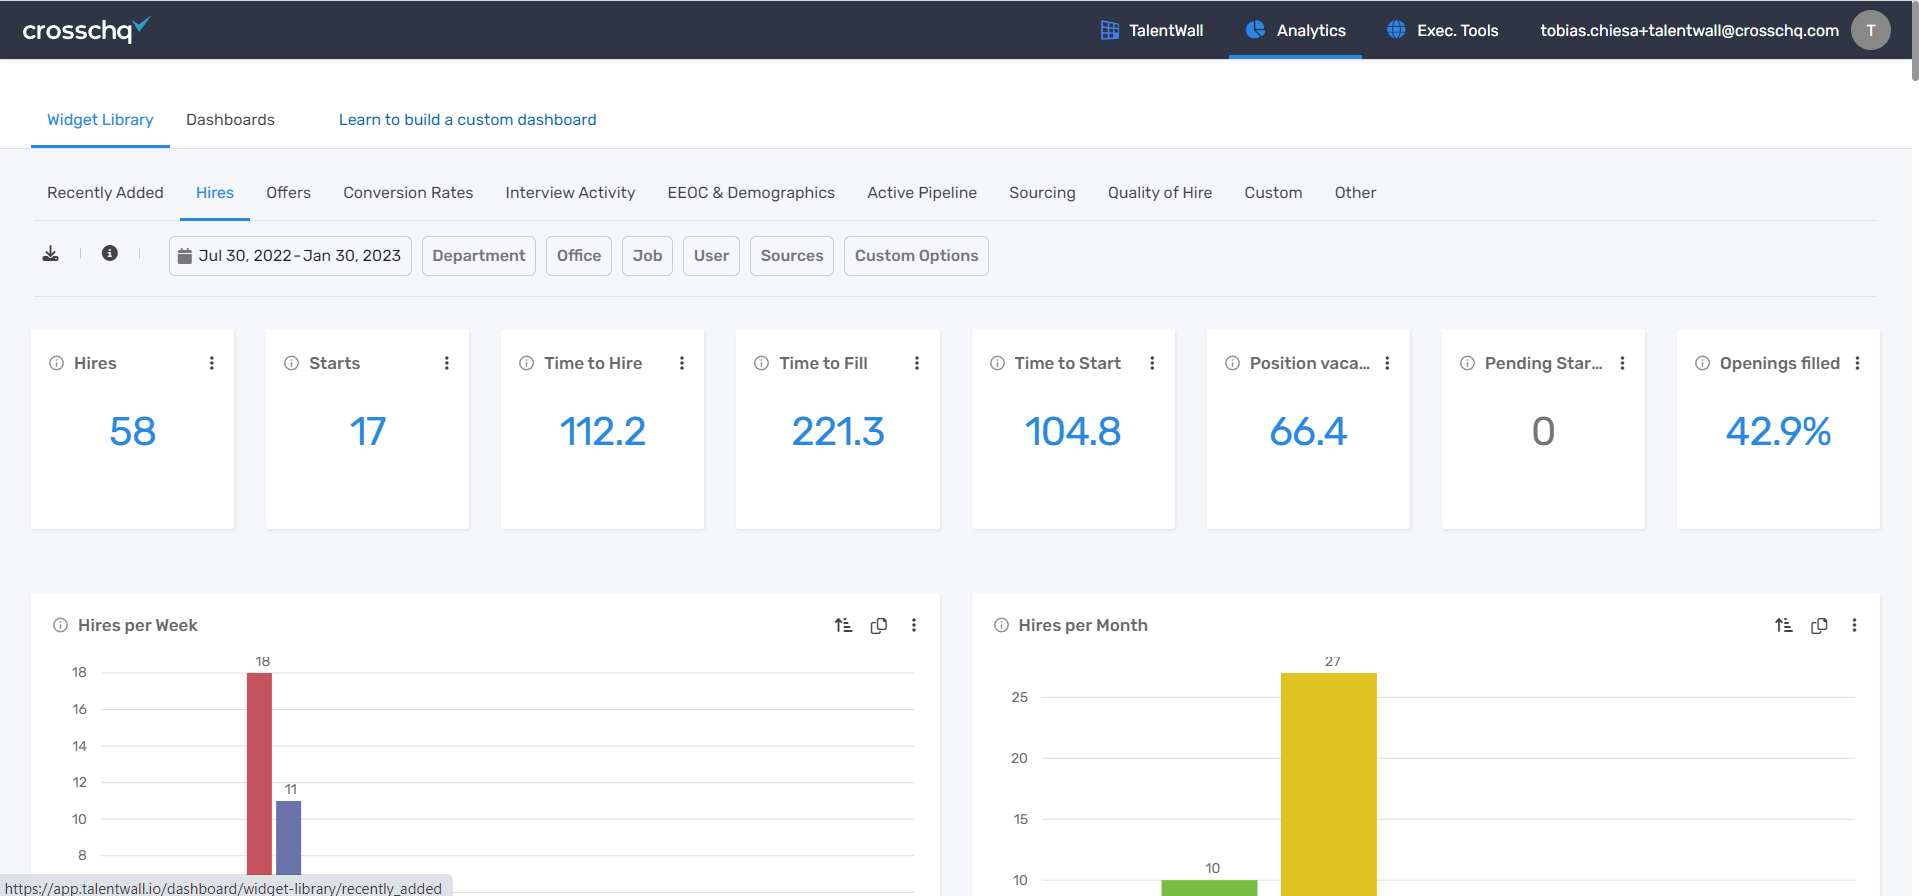
You'll find that TalentWall has dozens of pre-made widgets, which are all individual reports: Hires, Time to Hire, Offer Acceptance Rate, and Source of hire, to name a few. Each widget can be filtered by a custom date range, department, office, user, and custom field. This gives you easy access to some of the most frequently accessed reports by recruiting teams and execs.

Click the copy icon in any widget so you can paste it into an email or Slack to collaborate or celebrate great results:
Also, every bar in the bar charts and piece of pie in the pie charts are clickable, immediately showing you the candidates and data that the charts represent.
Customizable Dashboards
Want to create your own report with only the metrics that you need? You can build out your own customized Dashboards by selecting any widget from any of the widget libraries, and sending them to your own dashboard. You can create a dashboard for each of your recruiters, a team dashboard for your weekly recruiting team meeting, another dashboard for your monthly all hands hiring update, and any other report that you might want to build for other meetings. The data is always up to date and real-time, and you can easily share them with others.
See how to create a dashboard here:
Template Dashboards
If you don't want to build a dashboard from scratch, you can start off with our templates dashboards. Learn how here.