Located at the bottom of Executive Tools, Jobs Summary provides a customizable table of your jobs at an individual job level, to complement the aggregate view from Stages Summary.
Configuring Jobs Summary
Jobs Summary sorts the jobs visible to you by Open, Closed, or All jobs.
![]()
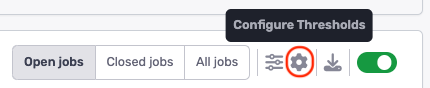
To edit the columns in your table, click the "configuration" icon from the Jobs Summary toolbar.
![]()
A window will appear where you can select which job columns to display on the table. Select and click the right or left arrows to add/remove columns. The list on the right side will be the columns exposed on the table.
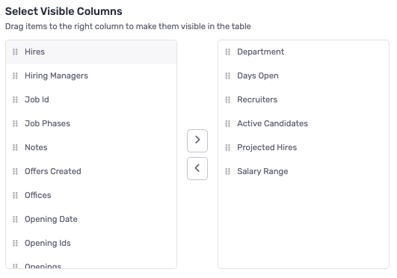
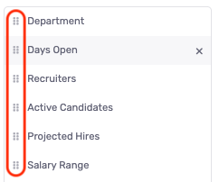
Click the dots to the left of the selected columns to rearrange the order of how they will appear.
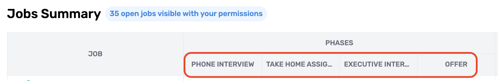
If you select Job Phases of Job Stages as a column, the table will include a column for each of your respective jobs/stages.
In addition, a new set of candidate metrics will be available for each phase from the column settings:
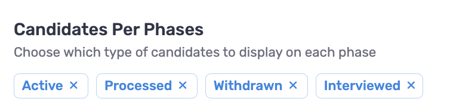
To enable a metric, click the name so that it turns blue. To remove a metric from being exposed in the jobs summary table, click the X beside the name. Below are how we define each candidate metric:
- Active - candidates that are still active in a job
- Processed - number of candidates who advanced, withdrew, or were rejected from the respective phase
- Withdrawn - number of candidates who withdrew from the respective phase
- Interviewed - number of candidates who had a scheduled interview in the respective phase
By default, each phase column will contain a phase conversion rate.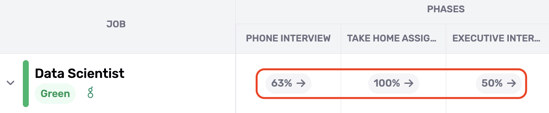 The conversion rate is defined as [number of candidates advanced from phase] divided by [number of candidates advanced, rejected, or withdrawn from stage]
For more information about TalentWall phases, please review this article.
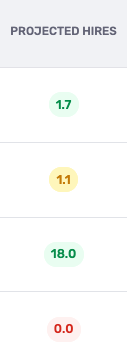
If you selected Projected Hires, Days Open, or Job Phases as a column in your Jobs Summary table, these metrics can be configured with additional color-coded thresholding.
You can set set a range of values to corresponding with a red, orange, and green color scheme.
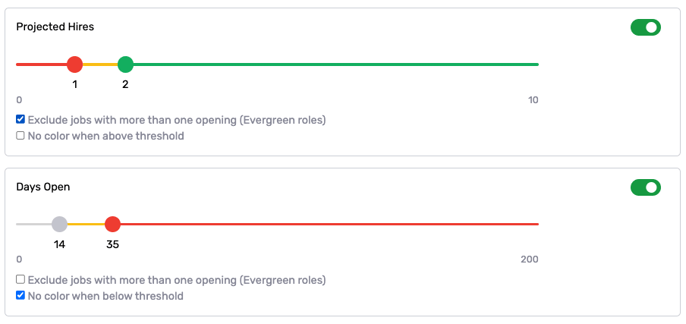
Afterward, the table will highlight these columns with the corresponding color thresholds.
Updating Jobs' Health Status
For each job in Jobs Summary, you can assign a color-coded health status as a quick visual gauge on the job's performance. Jobs can be updated as Green, Yellow, or Red.
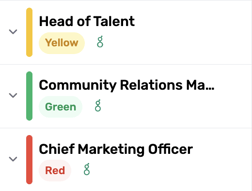
Job statuses can be updated from the Wall.
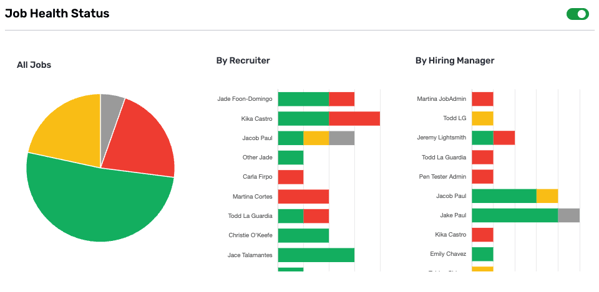
When job statuses are updated, they will also update the Job Health Status widgets in Executive Tools:
Viewing the Wall from Jobs Summary
For a more granular view of your jobs' active candidates, click the caret at the left of each job title to expand a copy of the Wall for the respective job:
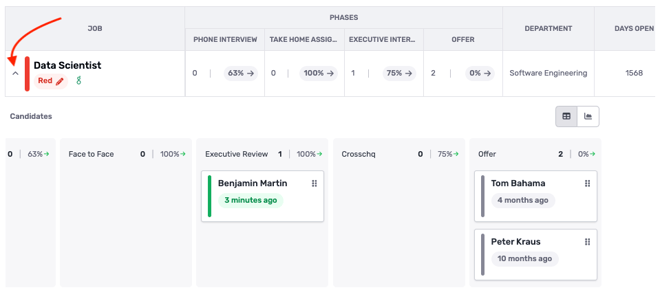
Candidates can be moved across stages similar to the Wall module.
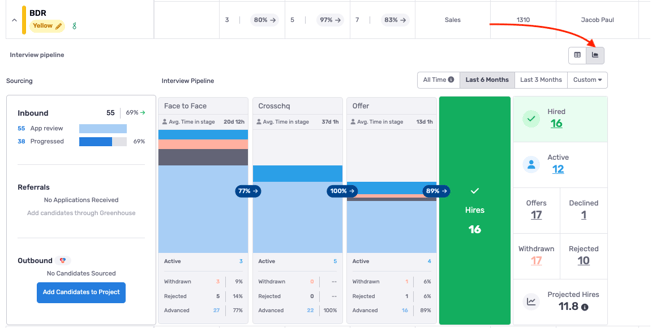
While the wall is expanded, you can also toggle to an individual Stages Summary display for the job:
Exporting Data from Jobs Summary
Data from Jobs Summary can be exported as a CSV by clicking on the download button from the Jobs Summary toolbar.
![]()
The next feature below is available only to Greenhouse customers.
In addition, the Jobs Summary table can be sent to an Analytics dashboard so you can see this data alongside other widgets. Click the arrow icon from the toolbar and select a dashboard to send the table.
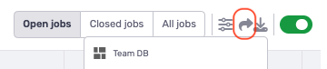
The table will appear as a new "widget" in the dashboard.
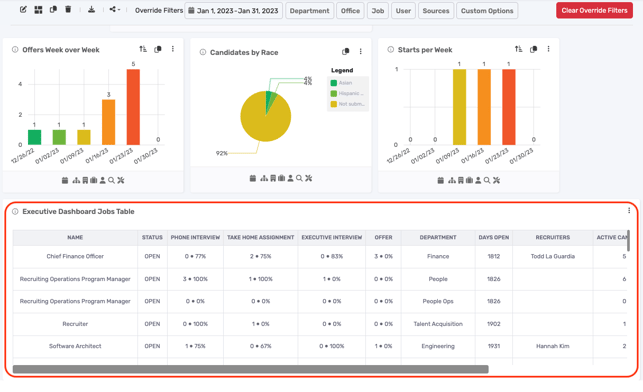
When sharing a jobs summary table to a dashboard, the "widgetized" table inherits all of the selected columns and filters from the table in Executive Tools at the time that it was shared. Any changes to the table in Executive Tools will not be reflected in the widget. It is not possible to edit a widgetized table after it has been sent to the dashboard. If edits are required, the table needs to be removed from the dashboard and re-added from Executive Tools with the correct filters and columns applied.